
失业后,他对Postgres下了「狠手」:“只改了32个参数,成功降速42000倍!”
你可以通过安装 BenchBase 的 Postgres 版本来测试这个配置:用 TPC-C 示例配置,测试时长 120 秒,预热 120 秒,128 个仓库,100 个连接,最大吞吐量设为 50k TPS。所以,如果我没理解错的话,我们可以用这种配置启动一个新的 Postgres 实例,然后再换成默认配置,这样就能声称我们把应用的速度提高了 42000 倍?从磁盘读数据很慢,所以 Postgre

【CSDN 编者按】在数据库性能优化成为常态的今天,本文作者反其道而行之,用近乎“行为艺术”的方式展现了 Postgres 配置的另一面 —— 通过调整 postgresql.conf 中的 32 个参数,让数据库性能暴跌 42000 倍。
原文链接:https://byteofdev.com/posts/making-postgres-slow/
作者 | Jacob Jackson
翻译 | 郑丽媛
出品 | CSDN(ID:CSDNnews)
投稿或寻求报道 | zhanghy@csdn.net
相信大家都在琢磨怎么让 Postgres 更快、更高效之类的,但有没有人想过:要是想让它变得尽可能地慢,该怎么做?
当然,我知道多数人研究提速都是为了拿工资的,可我失业了,目前并没有工作。原本呢,我是在写一篇正经的 Postgres 性能调优指南的,结果脑洞一开:要不试试搞个“反优化”版本,把 Postgres 配置成 “尽可能慢地处理查询” 模式?
总归我目前也没有工作,就这么随意造一次吧!

参数限制说明
我不能让这件事变得太简单。整体来说,这是一个 Postgres 参数调优的挑战,不是那种把 CPU 降到 1MHz 或删掉所有索引的简单做法,所有改动都得是postgresql.conf里的参数调整。此外,数据库还得能在合理时间内至少处理完一个事务——直接让 Postgres 彻底卡死也太没技术含量了。
所以,这件事其实比看起来更难,因为 Postgres 通过设置限制和简化配置,会尽可能避免用户犯这种“愚蠢的决定”。
为了测性能,我用了 Benchbase 实现的 TPC-C 测试,配置 128 个仓库,100 个连接(每个连接尝试以 10,000 TPS 的速率输出事务),后台数据库用 Postgres 19devel,系统是 Linux 6.15.6,硬件为 Ryzen 7950x 处理器、32GB 内存和 2TB SSD。
每轮测试持续 120 秒,分两次执行:第一次预热缓存,第二次收集数据。
在基准测试中,除了几个常规调整(例如调高 shared_buffers、work_mem、worker 进程数量)以外,其他所有配置我都保持默认——结果 TPS(每秒处理的事务数量)达到了不错的 7082。
那么接下来,就看看 Postgres 能被我折腾得有多慢吧。

缓存?算了吧……
Postgres 响应读取查询时之所以高效,很大程度上归功于强大的缓存机制。从磁盘读数据很慢,所以 Postgres 每次从磁盘读数据块时,都会把这个块缓存到内存里,这样下次有查询需要这个块时,就能直接从内存读取。
不过,我的目标是逼所有查询都用最慢的读取方式,所以这个缓存越小越好。
理论上来说,可以通过 shared_buffers参数来控制缓存大小。但很可惜,不能把它直接设为 0,因为 Postgres 也要用它来处理活跃的数据库页。不过幸运的是,我还是可以将它设得非常小。
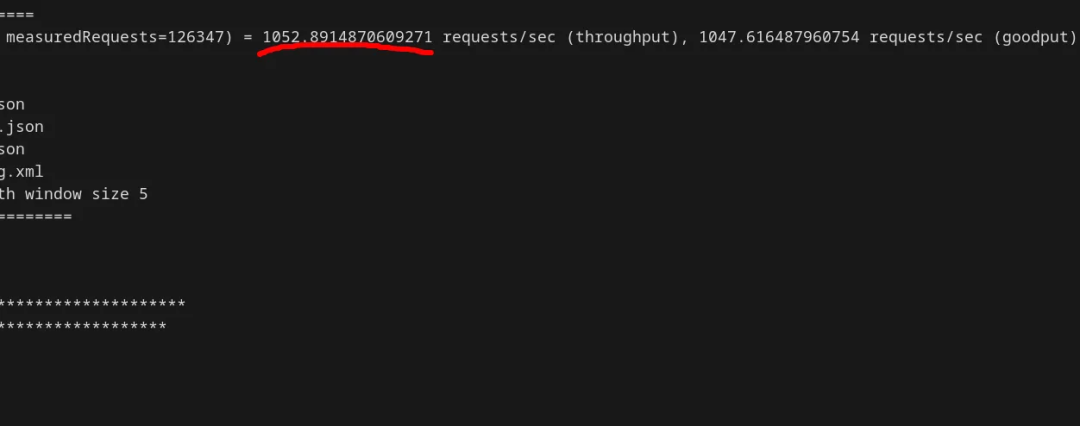
首先,我试着把基准测试中的 shared_buffers 从 10GB 降低到 8MB:
shared_buffers = 8MB在这个设置下,TPS 下降到了 1052,仅为初始速度的 1/7:
缓冲区被缩小后,Postgres 在内存中能保留的页面变少,这意味着无需访问操作系统就能满足的页面请求比例从 99.90% 骤降到 70.52%,导致读取系统调用的数量增加了近 300 倍。
但 70% 仍然太高,我们应该还能做得更“好”,进一步减小缓存空间。所以接下来,我尝试了缩小到 128kB,结果出现了错误:
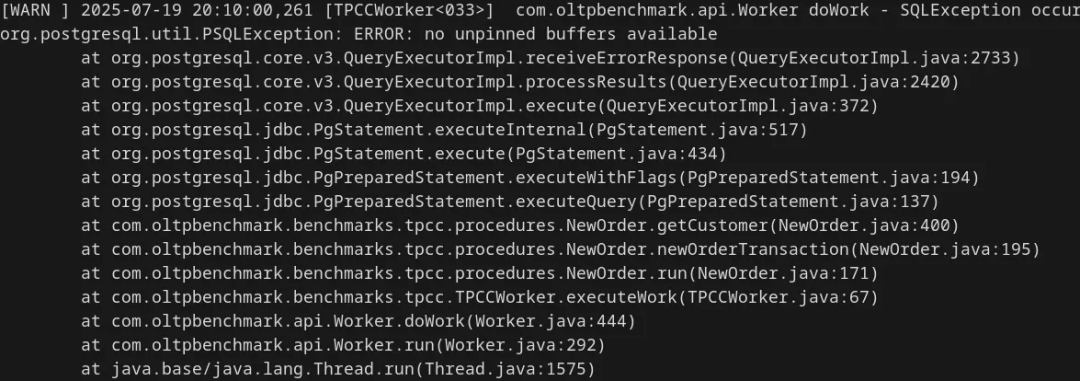
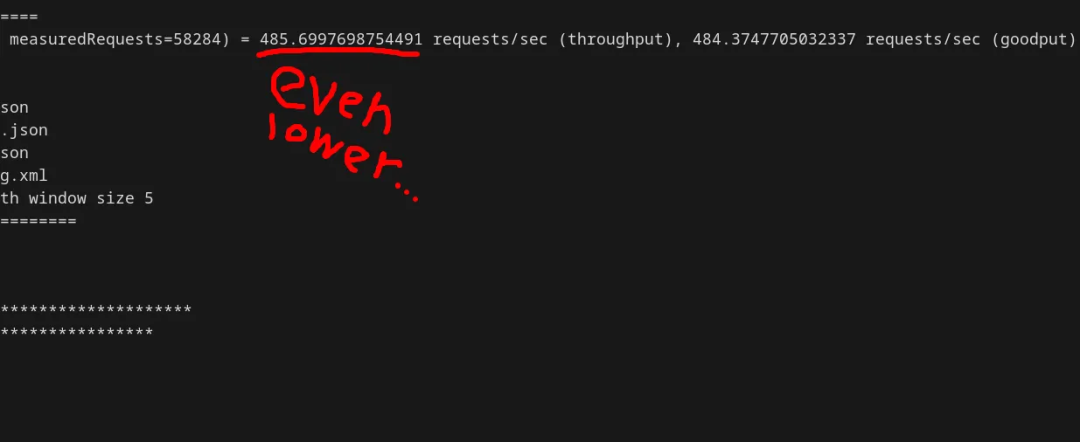
哎呀,128kB 的共享缓冲区最多只能存储 16 个数据库页面(不算共享缓冲区中的其他内容),而 Postgres 可能需要同时访问超过 16 个页面。折腾了一番后,我发现最小可行值约为 2MB:
shared_buffers = 2MB此时,Postgres 的 TPS 已经降到 500 以下了:

让 Postgres 尽量忙于“后台琐事”
Postgres 除了处理事务外,还有一些计算量不小的后台任务,我也可以用这些任务来制造拖延。为了减少存储碎片,Postgres 会定期运行 autovacuum(自动清理)进程,查找空闲空间(比如被删除的数据留下的空间),并试图重用。
一般情况下,为了避免影响性能,autovacuum 只有在发生一定数量的更改后才会运行。但我可以通过调整参数,让它随时触发:
autovacuum_vacuum_insert_threshold = 1 # autovacuum can be triggered with only 1 insertautovacuum_vacuum_threshold = 0 # minimum number of inserts, updates, or deletes needed to trigger a vacuumautovacuum_vacuum_scale_factor = 0 # proportion of the unfrozen table size to consider when calculating thresholdsautovacuum_vacuum_max_threshold = 1 # max number of inserts, updates, or deletes needed to trigger a vacuumautovacuum_naptime = 1 # the minimum delay between autovacuums in seconds; unfortunately, this cannot be set below 1, which limits usvacuum_cost_limit = 10000 # query cost limit, which, if exceeded, will cause the vacuum to pause; I don't want the vacuum to ever stop, so I maxed this outvacuum_cost_page_dirty = 0vacuum_cost_page_hit = 0vacuum_cost_page_miss = 0 # all of these minimize the cost for operations when calculating for `vacuum_cost_limit`我还调整了自动分析器(autovacuum analyzer),这个模块负责收集统计信息,用于后续的 vacuum 和查询计划(不过,就算是准确的统计信息也拦不住我胡搞):
autovacuum_analyze_threshold = 0 # same as autovacuum_vacuum_threshold, but for ANALYZEautovacuum_analyze_scale_factor = 0 # same as autovacuum_vacuum_scale_factor此外,我还得想办法让 vacuum 这个过程尽可能变慢:
maintenance_work_mem = 128kB # the amount of memory allocated for vacuuming processeslog_autovacuum_min_duration = 0 # the duration (in milliseconds) that a autovacuum operation is required to run for before it is logged; I might as well log everything;logging_collector = on # enables logging in generallog_destination = stderr,jsonlog # sets the output format/file for logs有一点需要说明:完全禁用 autovacuum 也能让性能慢慢下降,因为死元组逐渐会堆满。但由于这次测试以插入数据为主、持续时间只有两分钟,所以我觉得这个方案不够“慢”。
结果如何?TPS 降到了 293:
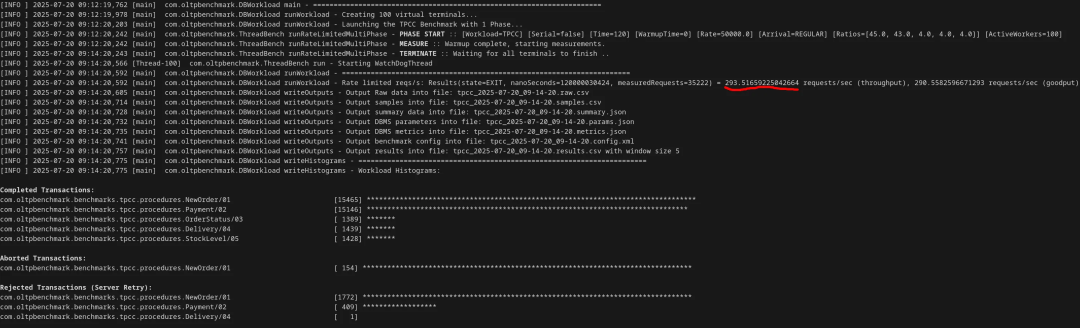
现在,Postgres 的性能已经降到初始值的 1/20 以下了。我通过查看日志确认了性能下降的原因:
2025-07-20 09:10:20.455 EDT [25210] LOG: automatic vacuum of table "benchbase.public.warehouse": index scans: 0 pages: 0 removed, 222 remain, 222 scanned (100.00% of total), 0 eagerly scanned tuples: 0 removed, 354 remain, 226 are dead but not yet removable removable cutoff: 41662928, which was 523 XIDs old when operation ended frozen: 0 pages from table (0.00% of total) had 0 tuples frozen visibility map: 0 pages set all-visible, 0 pages set all-frozen (0 were all-visible) index scan not needed: 0 pages from table (0.00% of total) had 0 dead item identifiers removed avg read rate: 116.252 MB/s, avg write rate: 4.824 MB/s buffer usage: 254 hits, 241 reads, 10 dirtied WAL usage: 2 records, 2 full page images, 16336 bytes, 1 buffers full system usage: CPU: user: 0.00 s, system: 0.00 s, elapsed: 0.01 s2025-07-20 09:10:20.773 EDT [25210] LOG: automatic analyze of table "benchbase.public.warehouse" avg read rate: 8.332 MB/s, avg write rate: 0.717 MB/s buffer usage: 311 hits, 337 reads, 29 dirtied WAL usage: 36 records, 5 full page images, 42524 bytes, 4 buffers full system usage: CPU: user: 0.00 s, system: 0.00 s, elapsed: 0.31 s2025-07-20 09:10:20.933 EDT [25210] LOG: automatic vacuum of table "benchbase.public.district": index scans: 0 pages: 0 removed, 1677 remain, 1008 scanned (60.11% of total), 0 eagerly scanned tuples: 4 removed, 2047 remain, 557 are dead but not yet removable removable cutoff: 41662928, which was 686 XIDs old when operation ended frozen: 0 pages from table (0.00% of total) had 0 tuples frozen visibility map: 0 pages set all-visible, 0 pages set all-frozen (0 were all-visible) index scan bypassed: 2 pages from table (0.12% of total) have 9 dead item identifiers avg read rate: 50.934 MB/s, avg write rate: 9.945 MB/s buffer usage: 1048 hits, 1009 reads, 197 dirtied WAL usage: 6 records, 1 full page images, 8707 bytes, 0 buffers full system usage: CPU: user: 0.00 s, system: 0.00 s, elapsed: 0.15 s2025-07-20 09:10:21.220 EDT [25210] LOG: automatic analyze of table "benchbase.public.district" avg read rate: 47.235 MB/s, avg write rate: 1.330 MB/s buffer usage: 115 hits, 1705 reads, 48 dirtied WAL usage: 30 records, 1 full page images, 17003 bytes, 1 buffers full system usage: CPU: user: 0.00 s, system: 0.00 s, elapsed: 0.28 s2025-07-20 09:10:21.543 EDT [25212] LOG: automatic vacuum of table "benchbase.public.warehouse": index scans: 0 pages: 0 removed, 222 remain, 222 scanned (100.00% of total), 0 eagerly scanned tuples: 0 removed, 503 remain, 375 are dead but not yet removable removable cutoff: 41662928, which was 845 XIDs old when operation ended frozen: 0 pages from table (0.00% of total) had 0 tuples frozen visibility map: 0 pages set all-visible, 0 pages set all-frozen (0 were all-visible) index scan not needed: 0 pages from table (0.00% of total) had 0 dead item identifiers removed avg read rate: 131.037 MB/s, avg write rate: 5.083 MB/s buffer usage: 268 hits, 232 reads, 9 dirtied WAL usage: 1 records, 0 full page images, 258 bytes, 0 buffers full system usage: CPU: user: 0.00 s, system: 0.00 s, elapsed: 0.01 s2025-07-20 09:10:21.813 EDT [25212] LOG: automatic analyze of table "benchbase.public.warehouse" avg read rate: 10.244 MB/s, avg write rate: 0.851 MB/s buffer usage: 307 hits, 337 reads, 28 dirtied WAL usage: 33 records, 3 full page images, 30864 bytes, 2 buffers full system usage: CPU: user: 0.00 s, system: 0.00 s, elapsed: 0.25 s# ... it continues similarly总之:现在 Postgres 几乎每秒都在对热点表执行 autovacuum 和 analyze,缓存命中率又低,只能不停从磁盘读取数据。更 “妙” 的是,因为每轮变化都不大,这些操作几乎是在做无用功。
但……我觉得 293 TPS 还是太高了。

把 Postgres 变成 Brandon Sanderson 式的“高产写手”
众所周知,Brandon Sanderson是个高产作家。你知道谁也可以“高产”吗?——等我改完 WAL 配置,我的这套 Postgres 就是了。
在将更改提交到实际数据库文件之前,Postgres 会先把这些更改写入 WAL(预写日志),然后通过 checkpoint(检查点)将这些变更同步到磁盘。WAL 的可配置性很强,这正好能为我所用。首先,Postgres 通常会在内存中缓冲部分 WAL 数据,然后批量写入磁盘。但我可不能让它这么高效:
wal_writer_flush_after = 0 # the minimum amount of WAL produced that requires a flushwal_writer_delay = 1 # the minimum delay between flushes我还想让 WAL 尽可能频繁地执行检查点:
min_wal_size = 32MB # minimum WAL size after checkpointing; I want to checkpoint as much as possiblemax_wal_size = 32MB # max WAL size, after which a checkpoint will happen. Unfortunately, I have to set both at 32MB minimum to match 2 WAL segmentscheckpoint_timeout = 30 # max time between checkpoints in seconds; 30s is the minimumcheckpoint_flush_after = 1 # flush writes to disk after every 8kB再最大化 WAL 写入量:
wal_sync_method = open_datasync # the method of flushing to disk; this should be the slowestwal_level = logical # makes the WAL output additional information for replication. The extra info isn't needed, but it hurts performancewal_log_hints = on # forces the WAL to write out full modified pagessummarize_wal = on # another extra process for backupstrack_wal_io_timing = on # more information collectedcheckpoint_completion_target = 0 # prevents spreading the I/O load at all结果:TPS 下降到 98,低于初始值的 1/70。
通过查看日志,可以确认这是由 WAL 效率低下导致的:
2025-07-20 12:33:17.211 EDT [68697] LOG: checkpoint complete: wrote 19 buffers (7.4%), wrote 2 SLRU buffers; 0 WAL file(s) added, 3 removed, 0 recycled; write=0.094 s, sync=0.042 s, total=0.207 s; sync files=57, longest=0.004 s, average=0.001 s; distance=31268 kB, estimate=31268 kB; lsn=1B7/3CDC1B80, redo lsn=1B7/3C11CD482025-07-20 12:33:17.458 EDT [68697] LOG: checkpoints are occurring too frequently (0 seconds apart)2025-07-20 12:33:17.458 EDT [68697] HINT: Consider increasing the configuration parameter "max_wal_size".2025-07-20 12:33:17.494 EDT [68697] LOG: checkpoint starting: wal2025-07-20 12:33:17.738 EDT [68697] LOG: checkpoint complete: wrote 18 buffers (7.0%), wrote 1 SLRU buffers; 0 WAL file(s) added, 2 removed, 0 recycled; write=0.089 s, sync=0.047 s, total=0.280 s; sync files=50, longest=0.009 s, average=0.001 s; distance=34287 kB, estimate=34287 kB; lsn=1B7/3F1F7B18, redo lsn=1B7/3E298BA02025-07-20 12:33:17.923 EDT [68697] LOG: checkpoints are occurring too frequently (0 seconds apart)2025-07-20 12:33:17.923 EDT [68697] HINT: Consider increasing the configuration parameter "max_wal_size".2025-07-20 12:33:17.971 EDT [68697] LOG: checkpoint starting: wal没错,正常情况下 WAL 检查点不该这么频繁(间隔才 487 毫秒)……但这还是不够。

从本质上“删除”索引
还记得开头我说过不能动索引吗?其实,我们可以通过让查询计划器“讨厌索引”来达到相同目的。
Postgres 在评估查询代价时,会区分随机访问和顺序访问,前者一般慢得多。索引扫描需要随机访问页面,而全表扫描通常是顺序访问。因此,只要把随机访问的代价设置得足够高,就能让优化器放弃索引。
random_page_cost = 1e300 # sets the cost of accessing a random pagecpu_index_tuple_cost = 1e300 # sets the cost of processing one tuple from an index只需修改这两个参数,几乎就能在所有情况下禁用索引。我最终还是把 shared_buffers 提回到 8MB,避免全表扫描出错,但这对性能显然没什么帮助。
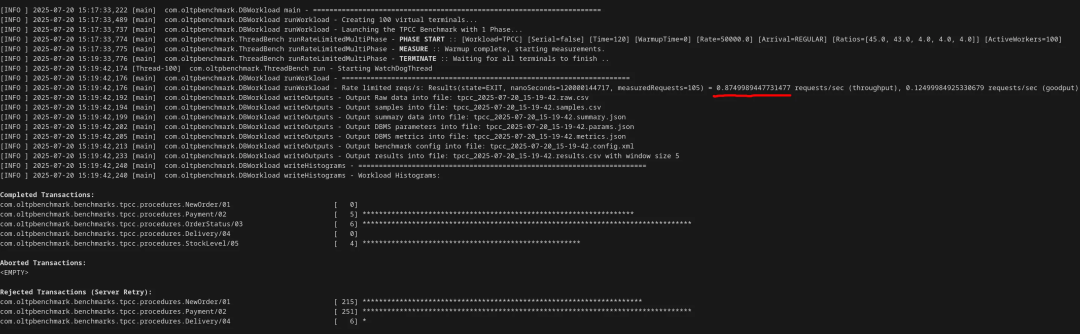
如此一来,TPS 下降至 0.87,已低于每秒 1 个事务,比默认配置慢了 7000 多倍——而这一切都只是改了 postgresql.conf 里的参数。
不过,我还有最后一招。

强制 I/O 进入单线程
虽然我不能让 Postgres 完全单线程(每个连接仍有独立进程),但在 Postgres 18 中新增了一个参数 io_method,可以控制线程是同步发起 I/O 系统调用(io_method = sync)、异步让工作线程发起系统调用(io_method = worker),还是使用新的 Linux io_uring API(io_method = io_uring)。结合 io_workers(当io_method=worker时,设置工作线程的最大数量),我能强制所有 I/O 都走一个线程:
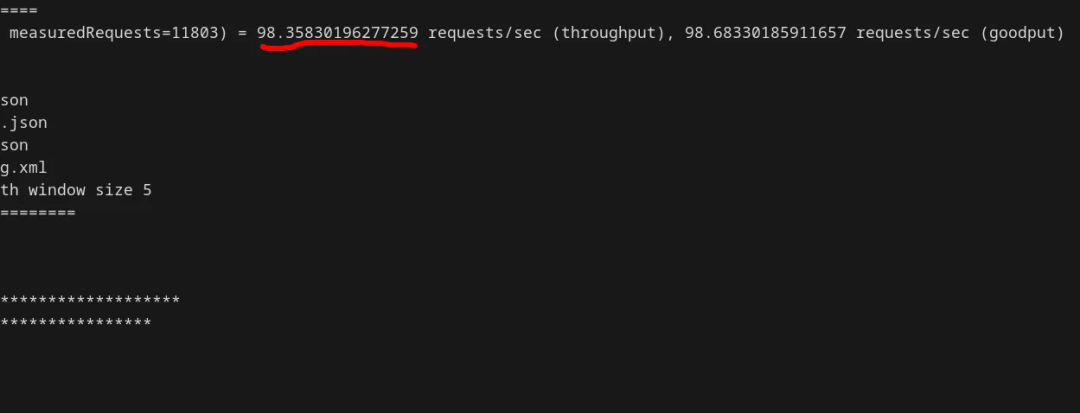
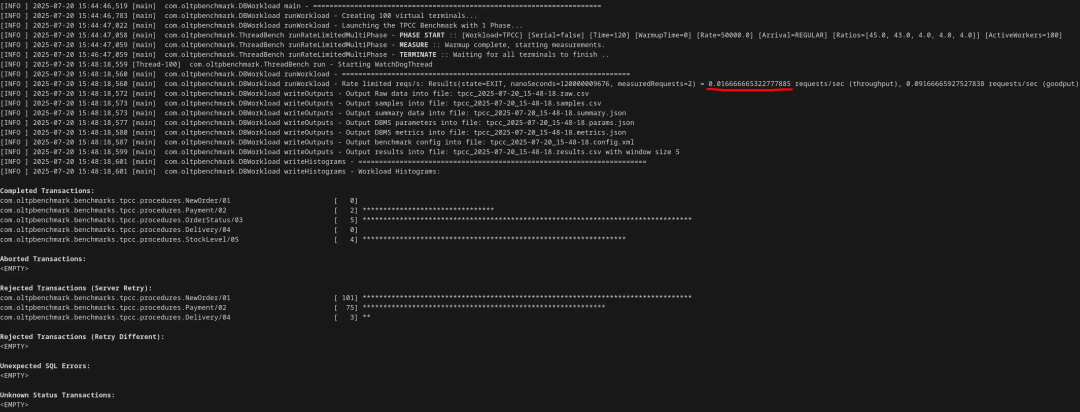
io_method = workerio_workers = 1然后,TPS 跌至 0.016,正式突破底线,性能下降超过 42000 倍!如果排除因死锁未完成的事务,情况会更“好”:100 个连接在 120 秒内,只成功完成了 11 个事务。

最终总结
折腾了几个小时,调了 32 个参数后,我成功 “搞垮” 了一个 Postgres 数据库。
谁能想到,光改个 postgresql.conf 就能把 Postgres 的性能糟践成这样?我本来以为最多只能把 TPS 降到个位数,没想到 Postgres 居然能被我折腾到这种地步。如果你想复现这个结果,以下是所有改过的非默认参数:
shared_buffers = 8MBautovacuum_vacuum_insert_threshold = 1autovacuum_vacuum_threshold = 0autovacuum_vacuum_scale_factor = 0autovacuum_vacuum_max_threshold = 1autovacuum_naptime = 1vacuum_cost_limit = 10000vacuum_cost_page_dirty = 0vacuum_cost_page_hit = 0vacuum_cost_page_miss = 0autovacuum_analyze_threshold = 0autovacuum_analyze_scale_factor = 0maintenance_work_mem = 128kBlog_autovacuum_min_duration = 0logging_collector = onlog_destination = stderr,jsonlogwal_writer_flush_after = 0wal_writer_delay = 1min_wal_size = 32MBmax_wal_size = 32MBcheckpoint_timeout = 30checkpoint_flush_after = 1wal_sync_method = open_datasyncwal_level = logicalwal_log_hints = onsummarize_wal = ontrack_wal_io_timing = oncheckpoint_completion_target = 0random_page_cost = 1e300cpu_index_tuple_cost = 1e300io_method = workerio_workers = 1你可以通过安装 BenchBase 的 Postgres 版本来测试这个配置:用 TPC-C 示例配置,测试时长 120 秒,预热 120 秒,128 个仓库,100 个连接,最大吞吐量设为 50k TPS。甚至,你还可以尝试比我更狠,进一步降低性能——毕竟,我只挑了那些我觉得对 Postgres 性能影响最大的参数,还有很多参数都没测试过。

网友评论:感觉可以应用到工组中?
这篇文章在 Reddit 上引起了不少开发者的兴趣,其中不少人指出或许这可以“应用”到工作中:
-
“所以,如果我没理解错的话,我们可以用这种配置启动一个新的 Postgres 实例,然后再换成默认配置,这样就能声称我们把应用的速度提高了 42000 倍?”
有人指出:“你不需要等到失业才这么做,我在日常工作中也经常这样。”
也有人感慨,这种趣味探索只能在业余时间展开:“这就是工作本身与业余乐趣之间的区别。随便捣鼓点东西,然后灵机一动‘这样弄的话会怎样’,这个过程总是很有趣。”
推荐阅读:
MoonBit Pilot:全球首个自底向上的代码智能体,比Cursor更快更稳定
被骂是“恶意软件分发者”,Linux开发者心灰意冷:项目停止维护!
知名AI遭黑客“投毒”,下载量超96万!开发者炸锅:一条带「自毁指令」的PR,差点“抹掉”整个云世界?
2025 全球产品经理大会
8月15–16日·北京威斯汀酒店
互联网大厂&AI 创业公司产品人齐聚
12 大专题,趋势洞察 × 实战拆解
扫码领取大会 PPT,抢占 AI 产品新红利


为开发者提供按需使用的算力基础设施。
更多推荐

 15
15 0
0- 0


 已为社区贡献9条内容

所有评论(0)