Matplotlib | 一文搞定Matplotlib从入门到实战演练!
Matplotlib 是一个 Python 的 2D绘图库。通过 Matplotlib,开发者可以仅需要几行代码,便可以生成绘图,直方图,功率谱,条形图,错误图,散点图等。官网https://matplotlib.org/\qquad学习Matplotlib 可让数据可视化,更直观的真实给用户。使数据更加客观、更具有说服力。Matplotlib是Python的库,又是开发中常用的库。
1 什么是Matplotlib
\qquad Matplotlib 是一个 Python 的 2D绘图库。通过 Matplotlib,开发者可以仅需要几行代码,便可以生成绘图,直方图,功率谱,条形图,错误图,散点图等。官网https://matplotlib.org/
\qquad 学习Matplotlib 可让数据可视化,更直观的真实给用户。使数据更加客观、更具有说服力。Matplotlib是Python的库,又是开发中常用的库
1.1 Matplotlib的安装
pip install matplotlib
1.2 Matplotlib的基本使用
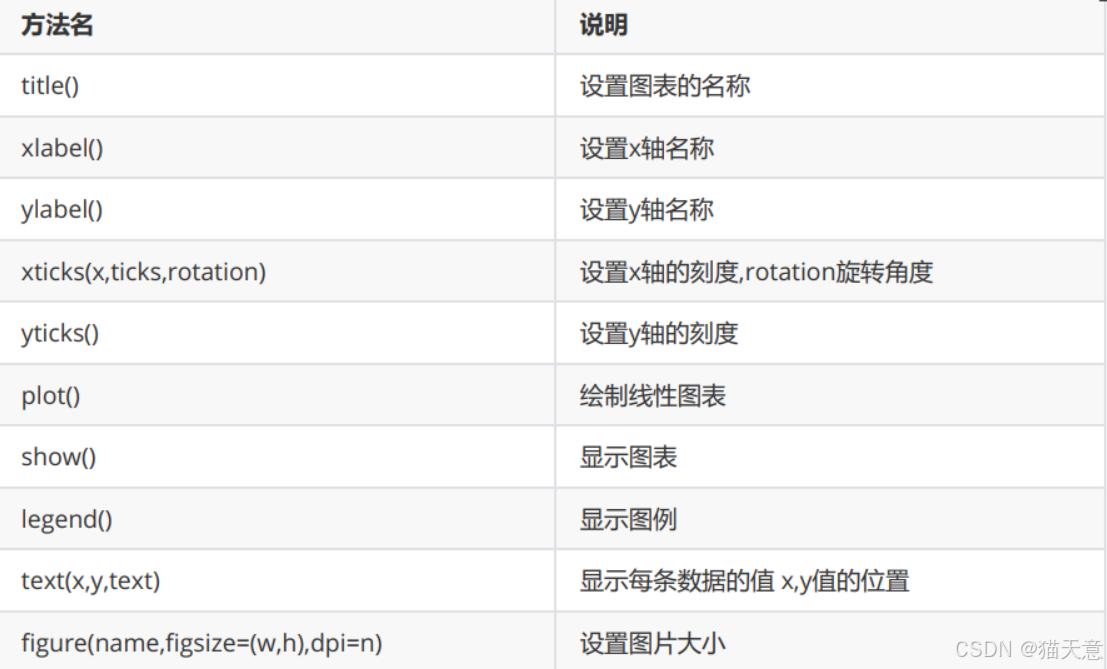
\qquad 在使用Matplotlib绘制图形时,其中有两个最为常用的场景。一个是画点,一个是画线。pyplot基本方法的使用如下表。
2 绘制直线
import matplotlib.pyplot as plt

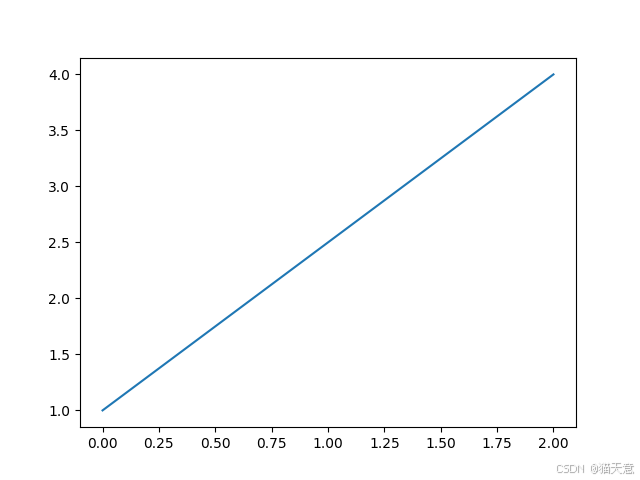
# 将(0,1)点和(2,4)连起来
plt.plot([0, 2], [1, 4])
plt.show()
3 绘制折线
import matplotlib.pyplot as plt

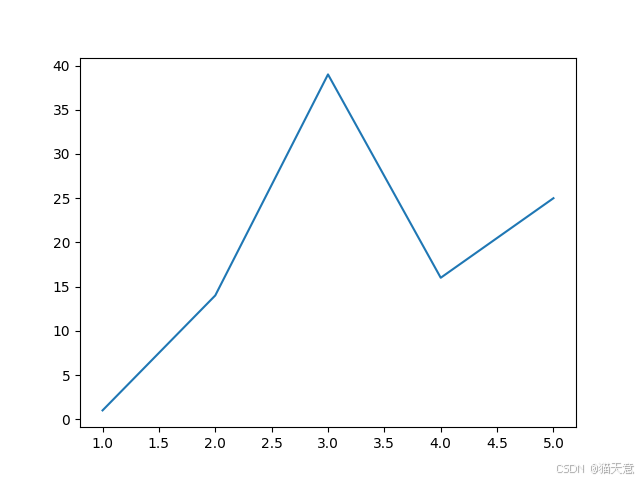
x = [1, 2, 3, 4, 5]
squares = [1, 14, 39, 16, 25]
plt.plot(x, squares)
plt.show()
设置标签文字和线条粗细
import matplotlib.pyplot as plt

datas = [1, 2, 3, 4, 5]
squares = [1, 14, 39, 16, 25]
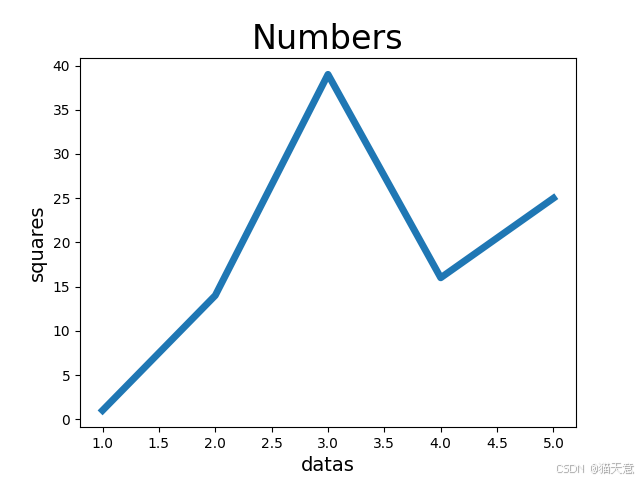
plt.plot(datas,squares,linewidth=5) #设置线条宽度
#设置图标标题,并在坐标轴上添加标签
plt.title('Numbers',fontsize=24)
plt.xlabel('datas',fontsize=14)
plt.ylabel('squares',fontsize=14)
plt.show()
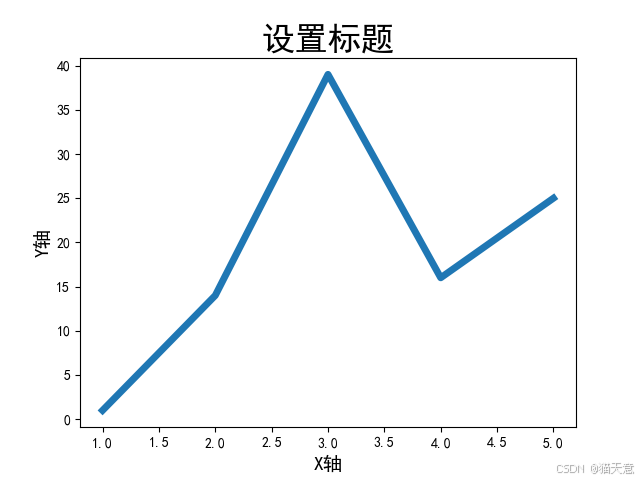
设置中文标题
Matplotlib 默认情况不支持中文,我们可以使用以下简单的方法来解决:
import matplotlib.pyplot as plt

# 准备数据
datas = [1, 2, 3, 4, 5]
squares = [1, 14, 39, 16, 25]
# 注意x和squares列表中元素个数要相同
plt.plot(datas, squares, linewidth=5)  # 设置线条宽度
plt.rcParams['font.sans-serif'] = ['SimHei']  # 用来正常显示中文标签
# 添加标题
plt.title('设置标题', fontsize=24)
# x轴添加标签
plt.xlabel('X轴', fontsize=14)
# y轴添加标签
plt.ylabel('Y轴', fontsize=14)
# 显示图形
plt.show()
风格的设置
import matplotlib.pyplot as plt

# 查看matplotlib中有哪些风格
# print(plt.style.available)

# 设置风格
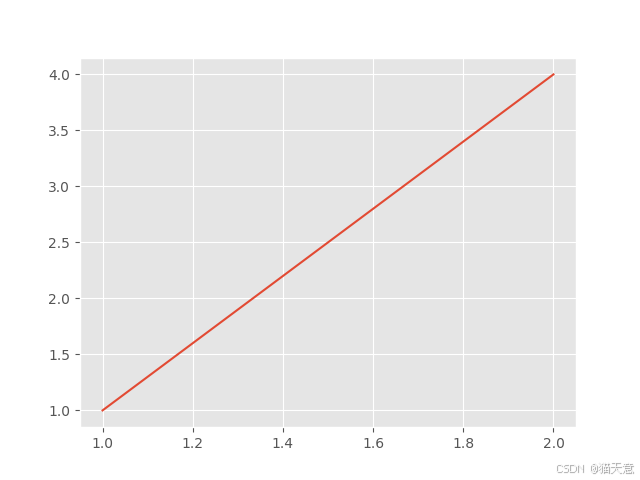
plt.style.use('ggplot')
plt.plot([1, 2], [1, 4])
plt.show()
某周最高温度和最低温度变化
import matplotlib.pyplot as plt

# 构造数据
max_temperature = [26, 30, 31, 32, 33]
min_temperature = [12, 16, 16, 17, 18]
x = range(5)
plt.rcParams['font.family'] = ['SimHei']
x_ticks = ['星期{}'.format(i) for i in
           range(1, 6)]
plt.title('某年某周第N周的温度')
plt.xlabel('周')
plt.ylabel('温度:单位(℃)')
# 设置x轴标签
plt.xticks(x, x_ticks)
# 填充数据
plt.plot(x, max_temperature, label='最高温')
plt.plot(x, min_temperature, label='最低温')
# 显示图例
plt.legend(loc=2)
plt.show()

4 绘制曲线
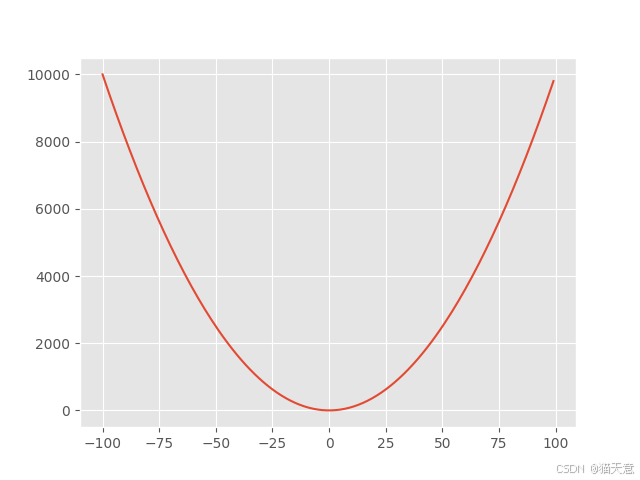
绘制曲线y=x^2
Matplotlib有很多函数用于绘制各种图形,其中plot函数用于曲线, 需要将200个点的x坐标和Y坐标分别以序列的形式传入plot函数,然后调用show函数显示绘制的图形。
【示例】一元二次方程的曲线
import matplotlib.pyplot as plt

# 准备数据 x是200个点
x = range(-100, 100)
# y = x**2
y = [i ** 2 for i in x]
# 设置风格
plt.style.use('ggplot')
# 调用plot
plt.plot(x, y)
# 保存图片
plt.savefig('y=x的平方.jpg')
plt.show()
绘制正弦曲线和余弦曲线
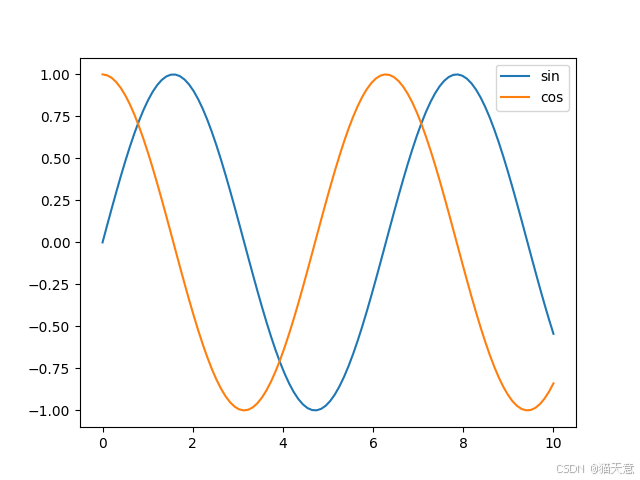
使用plt函数绘制任何曲线的第一步都是生成若干个坐标点(x,y), 理论上坐标点是越多越好。本例取0到10之间100个等差数作为x的坐标,然后将这100个x坐标值一起传入Numpy的sin和cos函数,就会得到100个y坐标值,最后就可以使用plot函数绘制正弦曲线和余弦曲线。
import matplotlib.pyplot as plt
import numpy as np

# 生成x的坐标(0-10的100个等差数列)
x = np.linspace(0, 10, 100)
y = np.sin(x)

# 绘制正弦曲线
plt.plot(x, y, label="sin")
# 绘制余弦曲线
plt.plot(x, np.cos(x), label="cos")
# 给图像加图例
plt.legend()
plt.show()
画布分区
【示例】subplot分区
import matplotlib.pyplot as plt
import numpy as np

x = np.linspace(0, 10, 100)
# plt.plot(x, np.sin(x))
# plt.plot(x, np.cos(x))

# 将画布分为区域,将图画到画布的指定区域 subplot()画布分区
# 将画布分为2行2列在第三个区域绘制图形
# 两种传递参数都可以
plt.subplot(2, 2, 1)
plt.plot(x, np.sin(x))
plt.subplot(222)
plt.plot(x, np.cos(x))
plt.subplot(2, 2, 3)
plt.plot(x, np.cos(x))
plt.subplot(224)
plt.plot(x, np.sin(x))

plt.show()
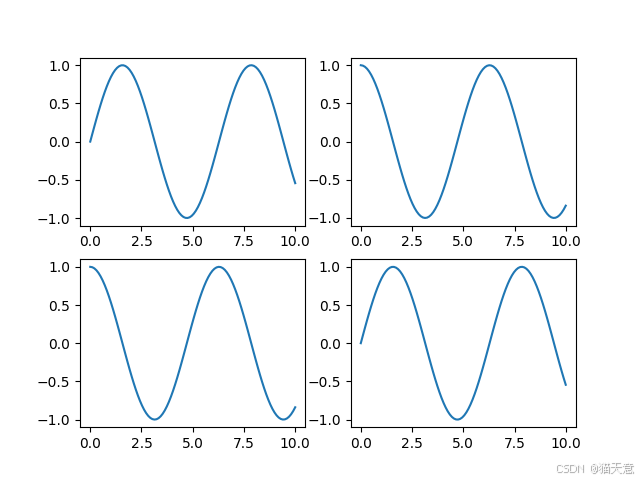
【示例】subplot分区
#将画布分为2行2列,将图画到画布的1区域
plt.subplot(221)
【示例】subplots分区
import matplotlib.pyplot as plt
import numpy as np

x = np.linspace(0, 10, 100)
# plt.plot(x, np.sin(x))
# plt.plot(x, np.cos(x))

# 将画布分为区域,将图画到画布的指定区域 subplot()画布分区
# 将画布分为2行2列在第三个区域绘制图形
# 两种传递参数都可以
plt.subplot(2, 2, 1)
plt.plot(x, np.sin(x))
plt.subplot(222)
plt.plot(x, np.cos(x))
plt.subplot(2, 2, 3)
plt.plot(x, np.cos(x))
plt.subplot(224)
plt.plot(x, np.sin(x))
# 使用subplots()进行画布分区
fig, ax = plt.subplots(nrows=2, ncols=3)
ax[0][0].plot(x, np.sin(x))
ax[1][2].plot(x, np.cos(x))
# ax[行索引, 列索引]
ax[0, 2].plot(x, np.sin(x))
ax[1, 0].plot(x, np.cos(x))
plt.show()
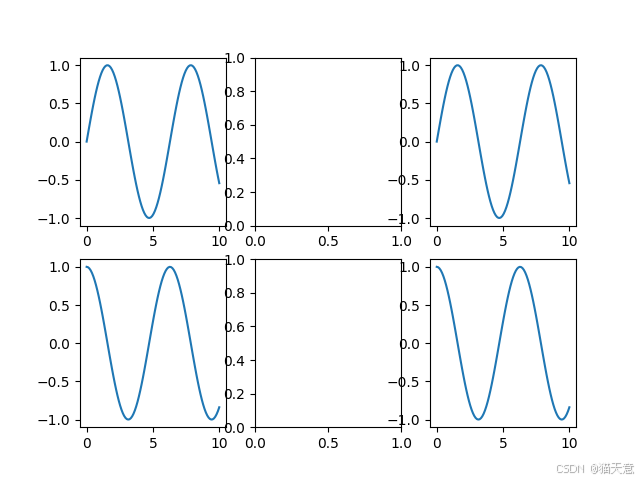
5 绘制散点图
用两组数据构成多个坐标点,考察坐标点的分布,判断两变量之间是否存在某种关联。
【示例】绘制散点图
import matplotlib.pyplot as plt
import numpy as np

# 画散点图
x = np.linspace(0, 10, 100)  # 生成0到10中100个等差数
# plt.scatter(x, np.sin(x))
plt.plot(x, np.sin(x), 'o')
plt.show()
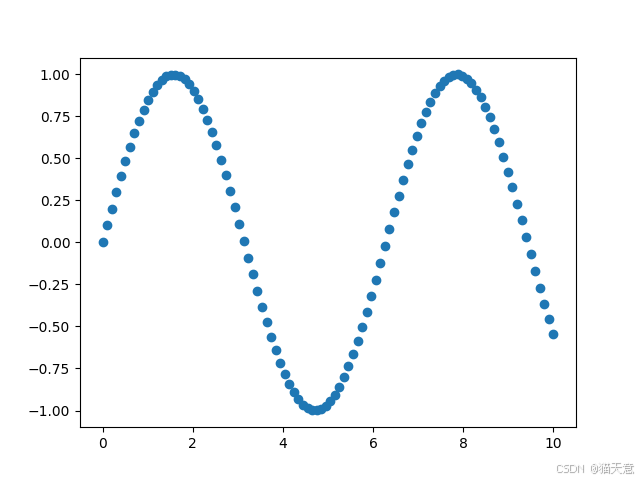
【示例】使用scatter绘制不同大小不同颜色的散点图
import matplotlib.pyplot as plt
import numpy as np

# 绘制不同大小不同颜色的散点图
np.random.seed(0)
x = np.random.rand(100)
y = np.random.rand(100)
colors = np.random.rand(100)
size = np.random.rand(100) * 1000
plt.scatter(x, y, c=colors, s=size, alpha=0.7)
plt.show()
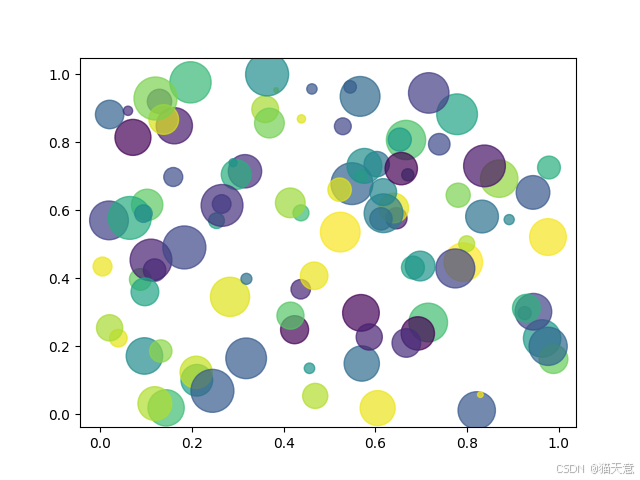
绘制不同种类不同颜色的线
作为线性图的替代,可以通过向 plot() 函数添加格式字符串来显示离散值。
可以使用以下格式化字符。
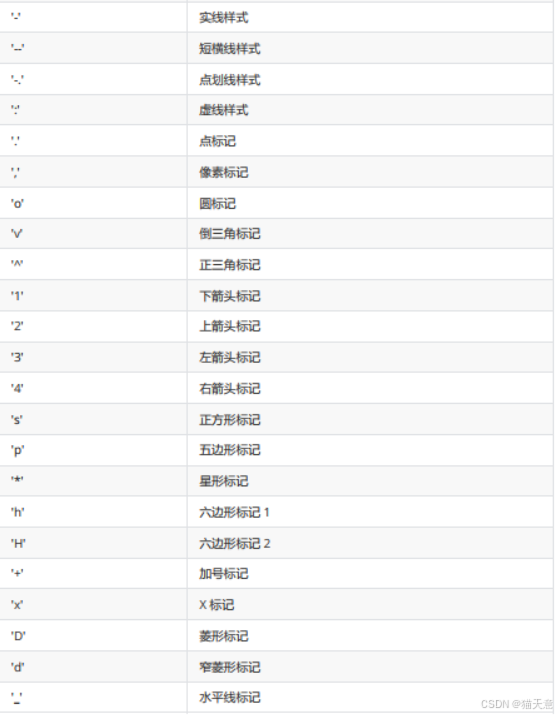
以下是颜色的缩写:
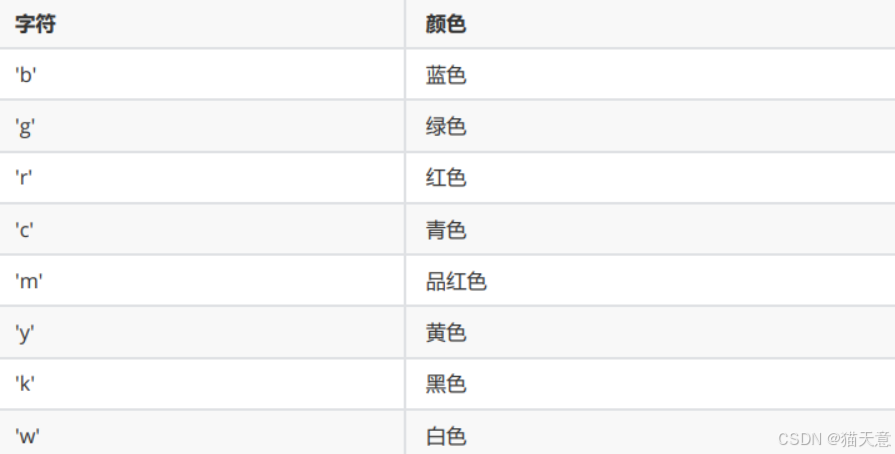
【示例】不同种类不同颜色的线
#不同种类不同颜色的线
x=np.linspace(0,10,100)
plt.plot(x,x+0,'-g') #实线 绿色
plt.plot(x,x+1,'--c') #虚线 浅蓝色
plt.plot(x,x+2,'-.k') #点划线 黑色
plt.plot(x,x+3,'-r') #实线 红色
plt.plot(x,x+4,'o') #点 默认是蓝色
plt.plot(x,x+5,'x') #叉叉 默认是蓝色
plt.plot(x,x+6,'d') #砖石 红色
【示例】不同种类不同颜色的线并添加图例
# 不同种类不同颜色的线并添加图例
x = np.linspace(0, 10, 100)
plt.plot(x, x + 0, '-g', label='-g')  # 实线 绿色
plt.plot(x, x + 1, '--c', label='--c')  # 虚线 浅蓝色
plt.plot(x, x + 2, '-.k', label='-.k')  # 点划线黑色
plt.plot(x, x + 3, '-r', label='-r')  # 实线 红色
plt.plot(x, x + 4, 'o', label='o')  # 点 默认是蓝色
plt.plot(x, x + 5, 'x', label='x')  # 叉叉 默认是蓝色
plt.plot(x, x + 6, 'dr', label='dr')  # 砖石 红色
# 添加图例右下角lower right 左上角upper left 边框 透明度 阴影 边框宽度
plt.legend(loc='lower right', fancybox=True, framealpha=1, shadow=True, borderpad=1)
import matplotlib.pyplot as plt
import numpy as np

# 准备数据
x = np.linspace(0, 10, 50)
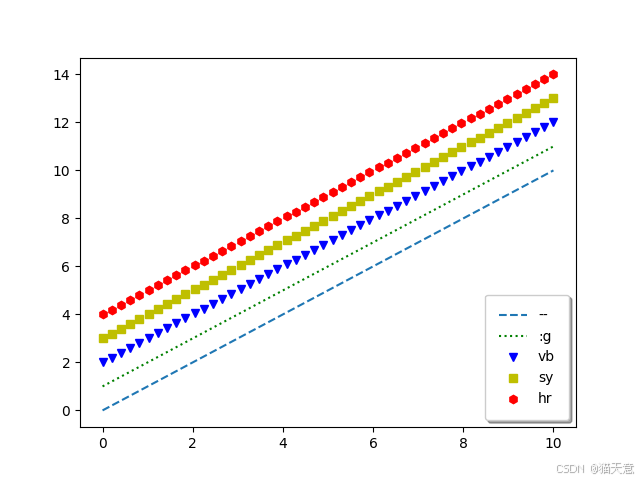
plt.plot(x, x + 0, '--', label='--')
plt.plot(x, x + 1, ':g', label=':g')
plt.plot(x, x + 2, 'vb', label='vb')
plt.plot(x, x + 3, 'sy', label='sy')
plt.plot(x, x + 4, 'hr', label='hr')
# 添加图例
# plt.legend(loc='lower right')

plt.legend(loc=4, fancybox=True, framealpha=1, shadow=True, borderpad=1)  # 要配合label去使用
plt.show()
6 绘制条形图(柱状)
条形图是用宽度相同的条形的高度或长短来表示数据多少的图形。 条形图可以横置或纵置,纵置时也称为柱形图。
使用bar函数可以绘制条形图。条形图主要用来纵向对比和横向对比的
bar(x,y,color,width) 函数来生成纵向条形图
barh(x,y,color,height) 函数来生成条形图
- x 条装显示位置
- y 显示的值
- color 显示的颜色
【示例】使用bar绘制柱状图,并设置柱的宽度
import matplotlib.pyplot as plt

plt.rcParams['font.sans-serif'] = ['SimHei']  # 用来正常显示中文标签

# 准备数据
x = [2020, 2025, 2030, 2035]
y = [12000, 30000, 10000, 50000]
# 调用bar绘制条形图
plt.bar(x, y, width=2)

# 设置xlabel, ylabel
plt.xlabel("年份")
plt.ylabel("销量")
# 添加标题
plt.title("4年的销售量")
# 调用xticks()
x_ticks = [f'{i}年' for i in x]
plt.xticks(x, x_ticks)
plt.show()
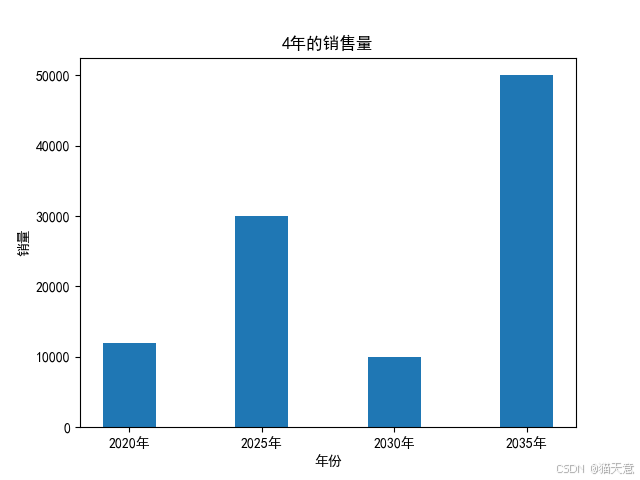
注意事项:bar函数的宽度并不是像素宽度。bar函数会根据二维坐标系的尺寸,以及x坐标值的多少,自动确定每一个柱的宽度,而 width指定的宽度就是这个标准柱宽度的倍数。该参数值可以是浮点数,如0。5,表示柱的宽度是标准宽度的0。5倍。
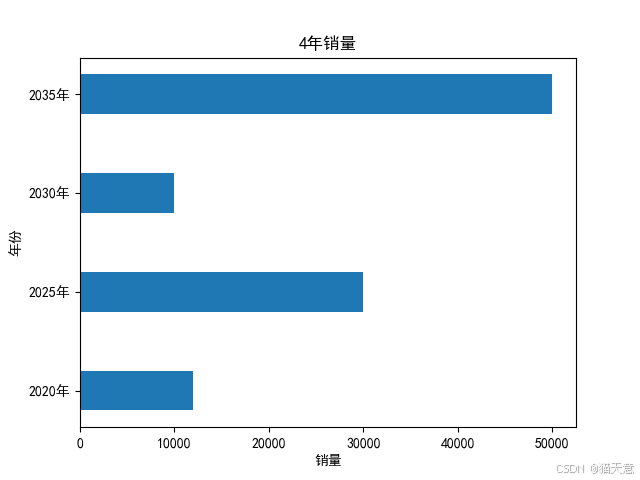
【示例】barh的使用
import matplotlib.pyplot as plt

plt.rcParams['font.sans-serif'] = ['SimHei']  # 用来正常显示中文标签

# 准备数据
x = [2020, 2025, 2030, 2035]
y = [12000, 30000, 10000, 50000]

# 设置条的高度
plt.barh(x, y, height=2)
# xlabel ylabe1
plt.xlabel('销量')
plt.ylabel('年份')
plt.title('4年销量')

y_ticks = [f'{i}年' for i in x]
plt.yticks(x, y_ticks)
plt.show()
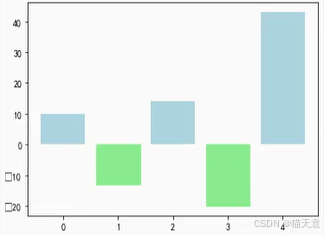
【示例】对部分条形图,使用颜色区分
import matplotlib.pyplot as plt

x = range(5)
y = [10, -13, 14, -20, 43]

v_bar = plt.bar(x, y, color='lightblue')
for bar, height in zip(v_bar, y):
    if height < 0:
        bar.set(color='lightgreen', linewidth='3')
绘制带方差的条形图
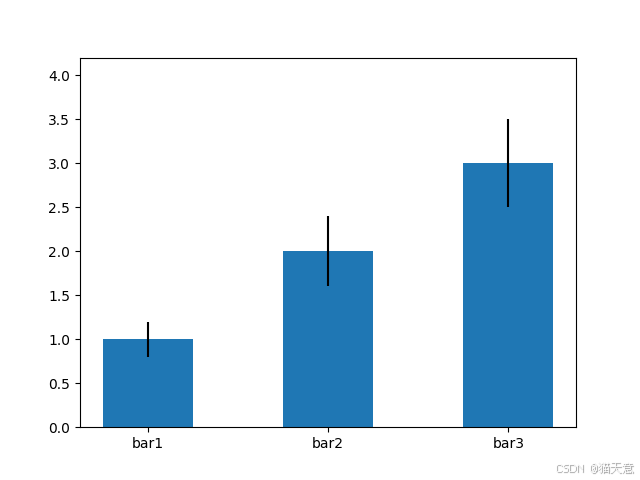
【示例】带方差的条形图
import matplotlib.pyplot as plt

# 准备数据
x = range(3)
x_label = ['bar1', 'bar2', 'bar3']
y = [1, 2, 3]
# 波动
variance = [0.2, 0.4, 0.5]
# 绘制柱形图
plt.bar(x, y, width=0.5, yerr=variance)
plt.xticks(x, x_label)
# 设置y轴坐标的范围 扩大范围
m = max(zip(y, variance))
maxy = (m[0] + m[1]) * 1.2
plt.ylim([0, maxy])
plt.show()
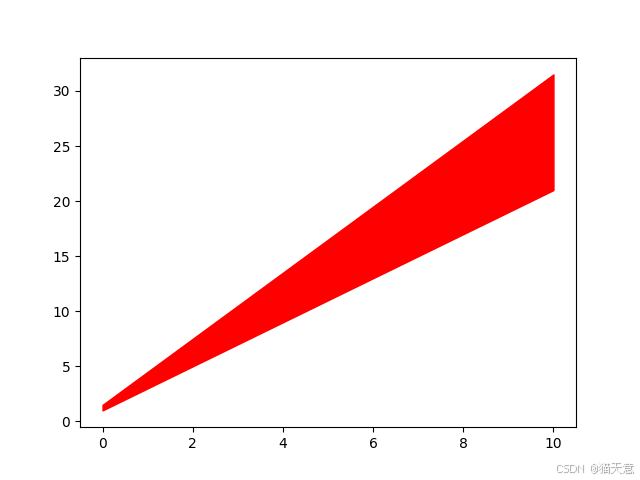
【示例】fill_between的使用
import matplotlib.pyplot as plt
import numpy as np

x = np.linspace(0, 10, 200)
y1 = 2 * x + 1
y2 = 3 * x + 1.5
plt.fill_between(x, y1, y2, color='red')
plt.show()
7 绘制饼状图
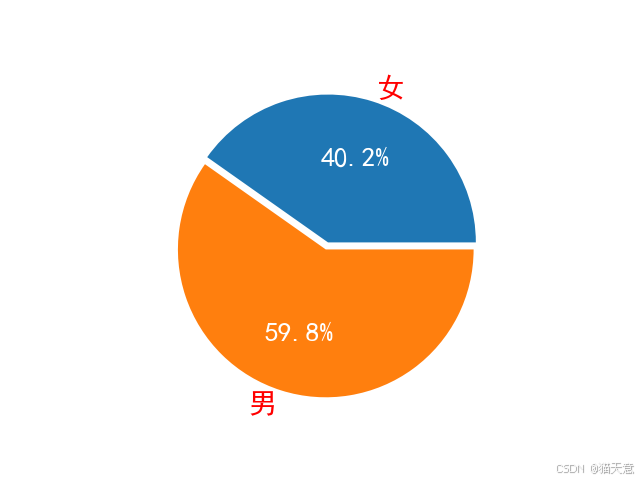
pie函数可以绘制饼状图,饼图主要是用来呈现比例的。只要传入比 例数据即可。
【示例】绘制饼状图
import matplotlib.pyplot as plt

plt.rcParams['font.sans-serif'] = ['SimHei']  # 用来正常显示中文标签
woman = 68187
man = 101351

# 计算男生女生所占的比
man_perc = man / (man + woman)
woman_perc = woman / (man + woman)
labels = ['女', '男']
color = ['blue', 'red']
# 调用pie绘制饼图 传入一个列表,列表中是比例数据
paches, texts, autotexts = plt.pie([woman_perc, man_perc], autopct="%0.1f%%", labels=labels, explode=(0, 0.05))
# explode裂开
# 设置字体大小和颜色
for text in autotexts:
    text.set_color("white")
    text.set_fontsize(20)
for t in texts:
    t.set_color("red")
    t.set_fontsize(20)
plt.show()
7 绘制直方图
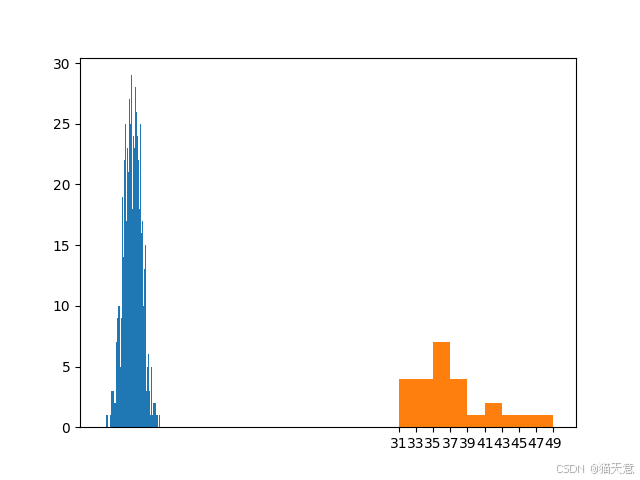
由一系列高度不等的纵向条纹或线段表示数据分布的情况,一般用横轴表示数据范围,纵轴表示分布情况。 特点:绘制连续性的数据,展示一组或多组数据的分布状况并统计
概念: 组距:每组数据的分割区域,例如1-5一组5-10一组。我们可以称数据的组距为5
组数:(最大数据-最小数据)/组距一般会100条数据可分5-12组
hist(data,bins,normed)
- data 所有的数据
- bins 分几组
- normed y轴是否显示成百分比
import matplotlib.pyplot as plt
import numpy as np

# 获取正太分布数据
x = np.random.randn(1000)
# 绘制直方图  hist
# plt.hist(x)
plt.hist(x, bins=100)
# 获取数据
data = [45, 49, 42, 42, 36, 37, 31, 38, 35, 39, 43, 33, 34, 36, 35, 36, 34, 32, 36, 32, 37, 33, 32, 38, 35]
max(data)
min(data)
# 设置组距
bin_width = 2
# 计算组数
bin_count = int((max(data) - min(data)) / bin_width)
bin_count
# 设置xticks
x_ticks = range(min(data), max(data) + 1, bin_width)
plt.xticks(x_ticks)
plt.hist(data, bin_count)
plt.show()
8 绘制盒图
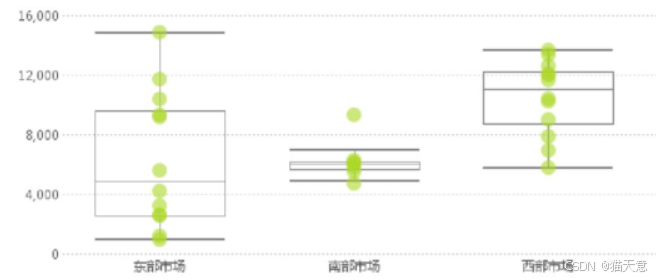
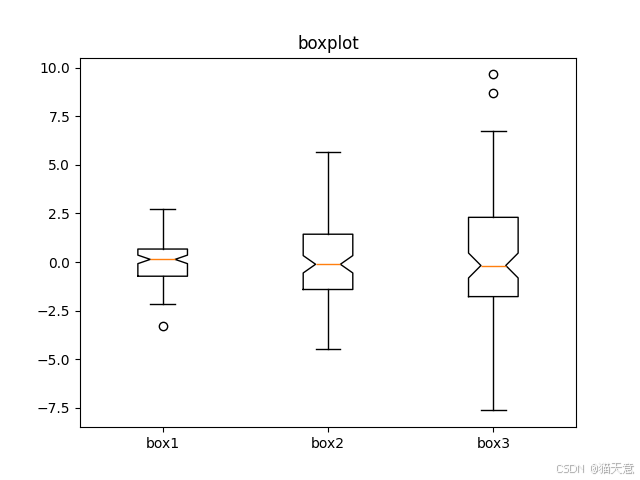
盒图尽管与直方图形态上有很大差异,但含义类似,都是用于表示分布状态,不过盒图还有一个功能,就是能体现数据的中位数Q2、 四分之一位Q1、四分之三位Q3和离群点IQR = Q3 Q1如果Q11.5IQR或者Q3+1.5IQR就是离群点。
import matplotlib.pyplot as plt
import numpy as np

# 准备数据 方差越大越分散 3就是很分散不集中 圈就是离群点
data = [np.random.normal(0, i, 100) for i in range(1, 4)]
# 调用boxplot()
# vert:是竖着画还是横着
# notch:切口 更好找到中位数
plt.boxplot(data, vert=True, notch=True)  # 默认是True
plt.title("boxplot")
plt.xticks([1, 2, 3], ["box1", "box2", "box3"])
plt.show()
9 绘制三维图
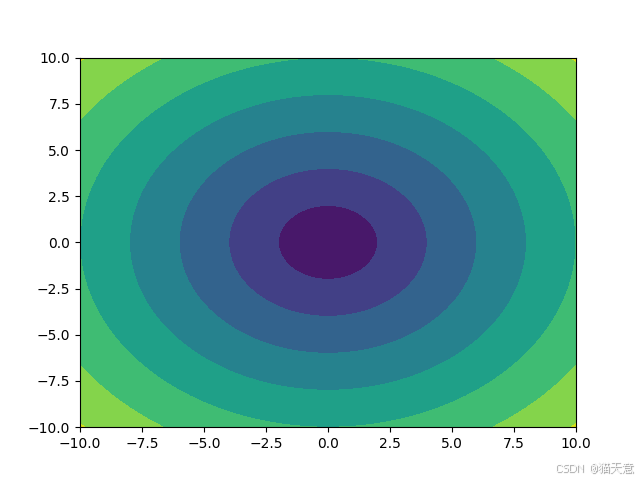
【示例】绘制三维图
import matplotlib.pyplot as plt
import numpy as np
from mpl_toolkits.mplot3d import Axes3D

# 准备数据
x = np.linspace(-10, 10, 100)
y = np.linspace(-10, 10, 100)
# 计算x y 的相交点
X, Y = np.meshgrid(x, y)
# 计算Z
Z = np.sqrt(X ** 2 + Y ** 2)
# 绘制三维图
# plt.contour(X,Y,Z)
plt.contourf(X, Y, Z)
# 三维画布绘制三维图
figure = plt.figure()
ax3d = Axes3D(figure)
ax3d.plot_surface(X, Y, Z)
plt.show()
练习
1. 用matplotlib绘制余切曲线并保存成图片。
2. 用matplotlib绘制生成3行2列的子画布,第1行第1列绘制余弦曲线和第3行第3列绘制正弦曲线。
3. 用matplotlib绘制一个饼状图(数据可以自定指定)。
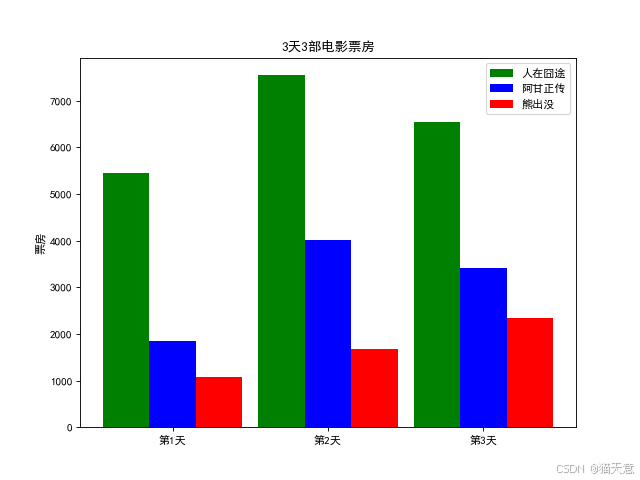
4. 用matplotlib绘制一个柱状图分析3部电影3天的票房。
import matplotlib.pyplot as plt

plt.rcParams['font.sans-serif'] = ['SimHei']  # 用来正常显示中文标签
# 准备
real_names = ["人在囧途", "阿甘正传", "熊出没"]
real_num1 = [5453, 7548, 6543]
real_num2 = [1840, 4013, 3421]
real_num3 = [1080, 1673, 2342]
# 设置画布大小figure(figsize=(w,h))

plt.figure(figsize=(8, 6), dpi=80)  # 640 * 480
# 调用bar绘制
x = range(len(real_names))
width = 0.3
plt.bar(x, real_num1, width=width, color='g', label=real_names[0])
plt.bar([i + width for i in x], real_num2, width=width, color='b', label=real_names[1])
plt.bar([i + width * 2 for i in x], real_num3, width=width, color='r', label=real_names[2])

# 设置xlabel ylabel
# plt.xlabel("天")
plt.ylabel("票房")
plt.title('3天3部电影票房')

x_ticks = [f"第{i + 1}天" for i in x]
plt.xticks([i + width for i in x], x_ticks)

# 添加图例
plt.legend()
plt.show()
import matplotlib.pyplot as plt

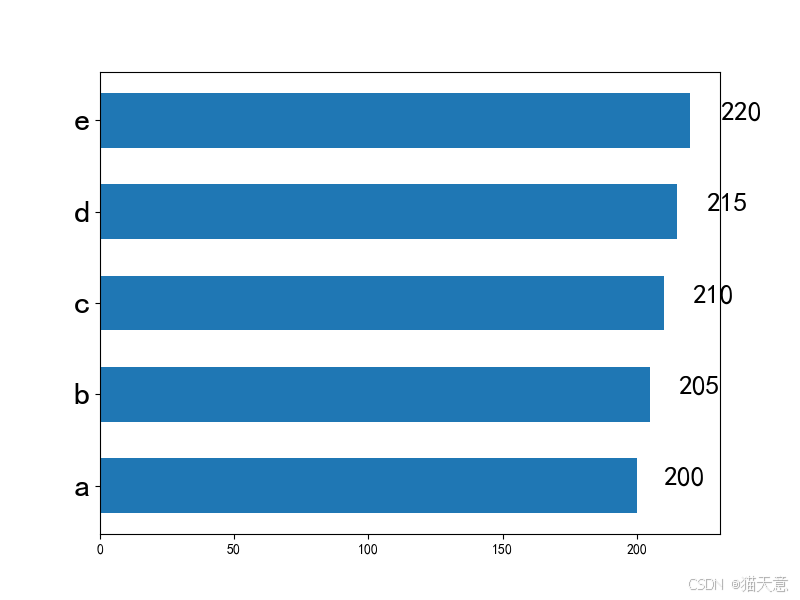
data = range(200, 225, 5)
bar_labels = ['a', 'b', 'c', 'd', 'e']
x = range(len(bar_labels))

# 设置画布
plt.figure(figsize=(8, 6))
bars = plt.barh(x, data, height=0.6)
# 设置yticks
plt.yticks(x, bar_labels, fontsize=24)
# 在指定坐标位置设置内容text
text_data = 1000000
for bar, d in zip(bars, data):
    x = bar.get_width() + bar.get_width() * 0.05
    y = bar.get_y() + bar.get_height() / 2
    text_data = d
    plt.text(x, y, text_data, fontsize=20)
更多推荐
 已为社区贡献1条内容


所有评论(0)